
Free
Try your first scientific illustration.
$0free account
- Image credits
- 2
- Agent conversations
- 2
2 welcome image credits, granted once with your Agent allowance after verification. No expiry and no monthly refill.
For the ideas behind the research
Build precise diagrams and charts, or create an AI illustration from your description.
Send your brief to plan a figure. Complex requests use your Agent allowance.
Start free · 2 Agent conversations + 2 AI image credits · No card required

Start with the task
Create a scientific image from your brief. Choose full color, review labels and structures, then download the original PNG.

Draw cells and biological subjects in color. Supply the structures, relationships and exact labels you want to show.

Keep records, reports and studies distinct in PRISMA 2020, or build a supported two-arm CONSORT 2025 trial flow.

Use Dot Plot, Bar Chart, Forest Plot, Kaplan–Meier or Heatmap with supplied observations, estimates or matrix values.

Turn supplied stages and variable relationships into native boxes, text and arrows with Framework or Graphical Abstract Diagram.

Build a 3–12 color palette, inspect background contrast and approximate color-vision previews, and copy code for your figures.
A considered workflow
Choose a tool that matches the task and bring your source material.
Check the data and rules before making a figure.
Revise inputs and export the formats supported by that tool.
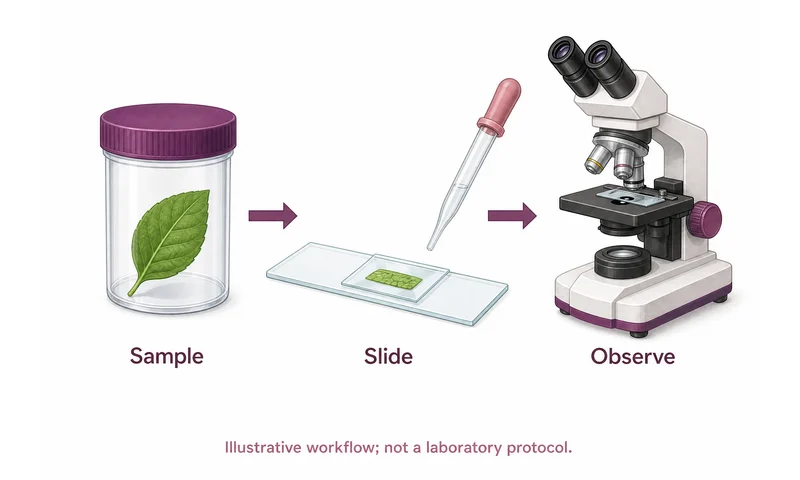
A reviewed, self-authored Image 2 2K output from an account test. This is a raster illustration of a conceptual workflow, not laboratory instructions or measured results.
Editable PowerPoint figures
Yes. Export native scientific diagrams and charts as PPTX, then edit their text, shapes and colors in PowerPoint. Labels stay as text boxes, so you can revise a figure without redrawing it.
Enter and check your data in a native tool. This example uses a PRISMA flow diagram.
Export the confirmed figure. Its text, boxes and connectors remain separate objects.
Revise a label, recolor a shape or adjust its position. Keep the diagram consistent with your source data.
What about AI illustrations? AI PNGs are raster images. Their embedded labels are not separate editable text boxes.
Make a PRISMA flow diagram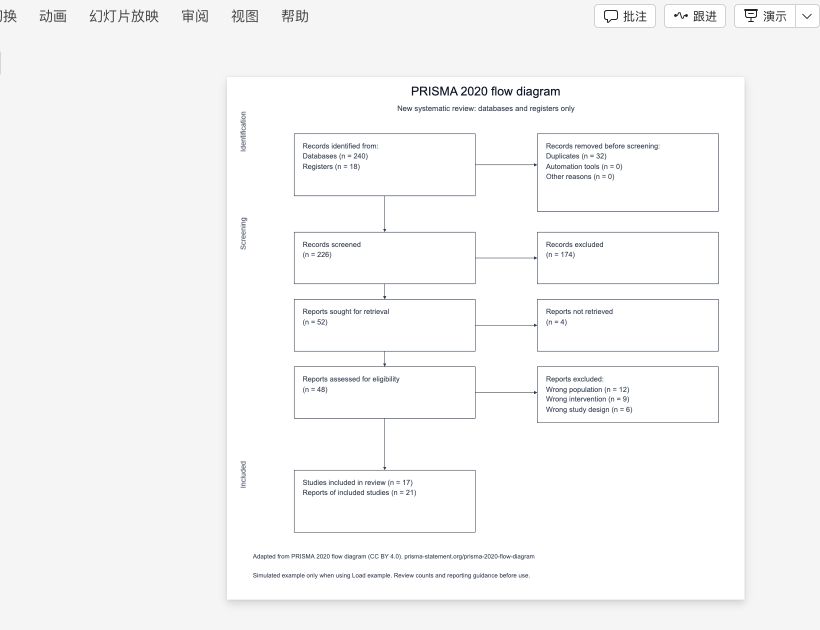
Checked in PowerPoint for the web. Fonts and layout can vary by editor; inspect your file before sharing. PRISMA example adapted under CC BY 4.0.
Use your exports in
Native PPTX keeps text and shapes editable in PowerPoint. Choose a supported format for other editors; font and layout support varies. These are export destinations, not connected integrations.

The confirmed observations and labels remain available in the native figure and its exports.
Reviewed output · self-authored simulated inputIf a count is missing, it should stay missing. If an input is invalid, the tool should explain which value needs attention. A tidy layout cannot make an incorrect result reliable.
Counts, estimates, event coding and matrix values have separate domain checks. All twelve native tools block export while edits are unconfirmed. AI can organize supplied fields; you review and confirm them before the engine draws the figure.
See what each export keeps editableThe figure toolbox
Explore the settings your figures can support, from research to teaching. AI-generated scenes with fictional people.

Give a paper a clear visual thread, from a study overview to a figure that explains the method.
Research papers
AI-generated scene · fictional people

Explain anatomy and clinical concepts with an illustration you can inspect and discuss.
Medical education
AI-generated scene · fictional people

Make biological structures and processes easier to follow in teaching and research materials.
Biology research
AI-generated scene · fictional people

Bring the stages of a study into a single visual overview.
Graphical abstracts
AI-generated scene · fictional people

Carry a clear figure into a poster, a lab meeting or a conference presentation.
Posters & presentations
AI-generated scene · fictional people

Keep the sequence visible when explaining a review, experiment or research plan.
Research workflows
AI-generated scene · fictional people
Explore all 22 tools for diagrams, data plots, teaching figures and standalone AI illustrations.
Paste numbers to create a dot plot. Values stack above their positions on the number line. Adjust labels, review the data, and export the chart.
Choose parent genotypes to create a Punnett square and calculate genotype and phenotype proportions under the selected inheritance assumptions.
Type an English sentence to create a Reed-Kellogg diagram for supported structures. Review ambiguous parses and see when a sentence is outside the tool's scope.
Enter your identification, screening, and included counts. Check the arithmetic and create a PRISMA 2020 flow diagram with supported manuscript exports.
Turn your study summary into a graphical abstract draft. Choose a structured vector diagram or an AI illustration, with the editing range clearly explained.
Start with a figure
Plan with the figure Agent and create 2K illustrations with Image 2. Native drawing and exports are free. How credits work ↗
One account per plan · Prices in USD
Try your first scientific illustration.
$0free account
2 welcome image credits, granted once with your Agent allowance after verification. No expiry and no monthly refill.
For figures you make each month.
$19.90/ month
Refreshes each paid billing period. No rollover.
$0.33 per image credit · $0.44 with Paper
For frequent generation and revisions.
$49.90/ month
Refreshes each paid billing period. No rollover.
$0.25 per image credit · $0.33 with Project
Available with or without a subscription. No automatic renewal.
Try a small set of illustrations.
$9.90one time
Image credits never expire. Conversations are valid for 31 days.
$0.66 per image credit
Finish the figures for a manuscript.
$19.90one time
Image credits never expire. Conversations are valid for 31 days.
$0.44 per image credit
Build up a reserve for a larger project.
$49.90one time
Image credits never expire. Conversations are valid for 31 days.
$0.33 per image credit
Checking purchase availability…
Twelve native tools, including the reviewed-role Sentence Diagram and deterministic Palette, run locally with SVG/PPTX, PNG and basic-Latin vector PDF. Data plots also export source CSV; Palette copies and downloads five code formats. Medical Illustration and Graphical Abstract Illustration use independent Image2 2K raster workspaces. Reviewed examples use self-authored simulated inputs; check the method and limits for your own data.
Yes. The twelve native tools export PPTX with editable text and shapes, so you can revise labels, colors and layout in PowerPoint. Representative exports have been opened and edited in PowerPoint for the web. Check fonts and layout in your version of PowerPoint. AI illustrations and PNG exports remain raster images; their labels are not separate text boxes.
Native tools are free to start. Eligible verified new accounts receive 2 welcome image credits and 2 Agent conversations once. Simple requests handled locally use neither allowance. Each successful Image 2 2K generation or reference revision uses 1 image credit. Downloads and saved works do not use image credits. Choose a monthly subscription or one-time credit pack for additional allowances. Prices and billing periods are shown before checkout.
Review the method, scientific accuracy, rights, and the target journal’s current AI and disclosure policies before submission. There is no universal publication guarantee.
Sign in to save figures to your private account. If you choose an AI action, its text and any selected Medical PNG reference are sent to KIE. Your saved works and AI results are private and are not automatically published as examples.